Oracle Enterprise Manager Concepts Guide


CHAPTER 5. Event Management
The Event Management System (EMS) allows you to monitor specific event conditions that occur in your network environment. You choose predefined events on nodes, databases, or listeners, then select the threshold parameters for which you want to be notified. You can notify specific system administrators when an event condition occurs. For some events, you can also choose to execute a "fixit" job that automatically corrects the problem.
The following topics are discussed in this chapter:
Event Management Process
The Event Management System allows you to efficiently monitor a large system. Using EMS and intelligent agents, you can effectively monitor a large number of databases 24 hours a day, and be alerted when a problem is detected. You can also pinpoint only those services you wish to monitor.
EMS can be extended to include other tools and applications that detect events independent of the intelligent agents. These tools and applications can be integrated into EMS and communicate directly with the intelligent agents.
In the Event Management System, event settings are stored based on the administrator registering the event. This allows administrators of large systems to customize their event systems to their preferences and tasks. Administrators receive only those messages related to the events that they have submitted.
The Event Management System includes the following processes:
- Setting up administrators, mail and paging services, and the system modem.
- Creating and registering an event set.
- Acknowledging and managing an event occurrence.
Determining Administrators
With EMS, you first set up the notification services and the administrators that need to be notified for the events. If you plan to notify administrators other than the current Console operator, you need to determine:
- The settings for the system modem.
- The mail and paging services that are used to contact administrators.
- The mail address and paging numbers for each administrator.
- The system responsibility and availability of each administrator.
Using Event Sets
Next, you need to create event sets, which are simply a group of events that you want to monitor. Oracle Enterprise Manager includes a variety of predefined events that you can use when creating event sets. The events are grouped by the following services:
Note: Only the UpDown events are included with Oracle Enterprise Manager. Additional events are available with the optional Performance Pack. For more information on events and their parameters, see "Predefined Events" ![[*]](jump.gif) .
.
Some events have parameters with suggested default threshold values that you can customize for your system. You can also create your own custom events. EMS events are implemented as Tcl scripts. For more information on writing custom event scripts, see the Oracle Enterprise Manager Application Developer's Guide.
You can also use several predefined event sets that have been installed with Enterprise Manager. See "Predefined Event Sets" .
Event sets are applied, or registered, to specific destinations, such as nodes, listeners, or databases. The status of an applied event set can be viewed in the Status page of the Modify Registration property sheet. This property sheet is displayed with the Modify Registration option of the Event menu.
The event scripts are stored, registered, and executed on a node with the permissions of the agent. Event scripts can save a state, such as values of global variables, between executions of an event script. This allows the agent to remember if it has already detected a certain event and eliminates redundant event messages to the Console.
The Event Management system uses the Console's daemon process to register event set information with the appropriate intelligent agents on nodes in the network. You determine the frequency that an agent checks an event. See "Frequency" for details on setting the frequency interval for an event.
Detecting Events
The agents are responsible for detecting when a specific event condition has occurred and, when specified, running a job to fix the problem.
Note: You need to create fixit jobs with the Job system before you can associate them with an event.
The events return color values depending on the severity of the event. The colors are displayed on the event severity icon that is located:
- Next to the event listed in the Event window.
- On the object in the map window. For information on the Map window, see "Map" .
The colors of the event severity icon are:
Note: Some events, such as UpDown, Probe, and User Blocks events, do not return a warning value because the warning threshold parameter is not used. The event has either occurred or not occurred.
Notifying Administrators
When an event condition occurs, the agent is responsible for alerting the Console and administrators. The administrators can be notified in various ways, such as electronic mail or paging. Notification occurs as follows:
- A notification is sent when the threshold of the event exceeds the level specified by parameter values. If the event does not have parameters, a notification is sent when the event occurs.
- If the threshold of the event remains above the level specified by parameter values longer than the specified frequency interval, a new notification is not sent.
- If the event condition changes from a warning to an alert, a new notification is sent.
- If the event condition changes from alert to warning, a new notification is sent to update the event window.
Each event is logged in the repository and can be viewed and acknowledged in the Event window of the Console. See Figure 5 - 1 for an illustration of the Event window.
Note: Refer to the appropriate documentation for information on how to correct event conditions. For example, if an Oracle database problem occurs, refer to the Oracle7 Server Administrator's Guide.
Predefined Events
The database, listener, and node, predefined events are grouped into categories:
Note: Only the UpDown events are included with Oracle Enterprise Manager. Additional events are available with the optional Performance Pack. For more information on events and their parameters, see "Predefined Events" .
Fault Management Events
This category of events monitors for catastrophic conditions on the system, such as a database, node, or listener is down. Immediate action needs to be taken by the administrator. Examples of events available in this category include:
Most of these events do not require any threshold values because the event checks whether the service is up or down.
Space Management Events
This category of events tracks possible space problems, such as running out of space on a disk or archive device. Examples of space management events in this category include:
To check for space management events, set a threshold on the free space left. For example, set an alert if the free space on a disk falls below a specific number of bytes.
In order to properly choose the threshold value, you need to know the characteristics of the tablespaces. For example, you would want to know whether the tablespaces contain online transaction processing (OLTP) tables or decision support tables. The former usually has a very fast growth rate, while the latter almost never grows.
Resource Management Events
This category of events tracks possible resource problems, such as exceeding datafile or lock limits. Examples of resource management events in this category include:
To check for resource management events, set a threshold on the percentage of a resource used. For example, you can set an alert if the percentage of the datafile resource used is greater than a specified value.
Performance Management Events
This category of event monitors the system for performance problems, such as excessive CPU load or library cache miss rate. Examples of events in this category include:
To check for performance management events, set a threshold on a system value. For example, you can set an alert if the library cache miss rate is greater than a specific value. The set of threshold values is system specific, depending on the hardware platform, number of users, and other factors.
Event Window
The Event Management window contains the following pages:
You can switch between the pages by clicking on the tab of each page. The rows in both pages can be sorted on any column by clicking on the column heading. See Figure 5 - 1 for an illustration of the Event window.
The Event window can be hidden or shown by selecting Show Event Pane in the Console View menu. You can also hide or show the window by clicking on the square clock icon in the Console toolbar.
 Figure 5 - 1. Event Management Menu and Window
Outstanding Events Page
The Outstanding Events page displays event sets that have been applied and have occurred.
| Severity | Severity of the event: alert, warning, and clear. These are represented by red, yellow, and green circles. |
| Event | Name of the event. |
| Node | Node where the event was monitored. |
| Type | Type of service that the event monitors, such as Database, Listener, or Node. |
| Destination | The service that is being monitored. |
| Date | Date of the event. |
| Event Message | Message associated with the event, such as "Database went down" or "Tablespace SYSTEM reached 90% capacity." |
| Ack. Text | The comment entered when the event was acknowledged. |
Acknowledging Events
To acknowledge an event that has occurred, double-click on the event to display the Acknowledge Event property sheet. You can also select an event and choose the Acknowledge option in the Event menu. When you acknowledge an event, you can enter notes on the nature and progress of the event condition. See "Acknowledging an Event" .
Event History Page
The Event History page displays a history of events that have occurred and have been acknowledged by an administrator or cleared by an agent. The Event History Page contains the same columns as the Outstanding Events page, plus the following:
| Cleared By | Name of user that cleared the event. |
| Ack. Date | Date that the event was acknowledged. |
Viewing Acknowledgements
To view any comments made by the administrator that acknowledged the event, double-click on the event to display the Acknowledge Event dialog box.
Saving Event History
You can save the events from the Event History page to a text file and clear the events from the Event History window. This prevents the Event History page from being overloaded with obsolete events that occurred in previous days.
Registrations Page
The Registrations page displays the event sets that have been applied and registered to monitor events on any network objects. The Registrations page contains the following information:
| Type | Type of event set, such as Database, Node, or Listener is signified by an icon. |
| Destination | The service that event is monitoring. |
| Set Name | Name of the event set that is registered. |
| Event Status | The number of the pending, and successful, and failed events in the event set. |
Modify Registrations Property Sheet
Double-click on a registered event set to display the property sheet for the event set. The property sheet allows you to view and modify registration information. The status page has a detailed view of the status of each event.
Event Set Library Page
The Event Set Library page displays the event sets that have been created. The Event Set Library page contains the following information:
| Type | Type of event set, such as Database, Node, or Listener is signified by an icon. |
| Set Name | Name of the event set. |
| Description | Description of the event set. |
| # of Events | Number of events in the set. |
Event Set Property Sheet
Double-click on an event set to display the property sheet for the event set. The property sheet allows you to view and modify the event sets.
Predefined Event Sets
Several predefined event sets have been installed with Enterprise Manager. These appear in the Event Set Library page of the Event window. You can apply these event sets to destinations on your network. The predefined event sets include:
Note: Listener events are not available with this release.
Note: Only the UpDown event sets are included with Oracle Enterprise Manager. Additional event sets are available with the optional Performance Pack.
To view the specific events assigned to these event sets, double-click on the event set in the Event Set Library page and view the Event page of the Event Set Management property sheet. For more information on predefined events and their parameters, see "Predefined Events" .
Event Menu
The Event menu allows you to set up event set and administrator information. This menu also provides options to register, track, and view specific events. Menu options are enabled depending on the items selected in the Event window. See Figure 5 - 1 for an illustration of the Event menu.
Note: When you register or remove an event, there is usually a slight delay while the agent processes the request.
| Acknowledge Event | Acknowledges the selected event in the Outstanding Events page. |
| | Enter any optional comments on the nature or progress of the event condition in the General page of the Acknowledge Event property sheet, then click on the Move to History button to move the event to the Event History page or click on the Keep button to leave the event in the Outstanding Events page. See "Acknowledging Events" . |
| Register Event Set | Registers, or applies, the selected event set to a destination. This action monitors the destination, or network object. See "Registering an Event Set" . |
| Modify Registration | Modifies the selected registered event set. See "Registering an Event Set" . |
| Remove Registration | Removes the selected registered event set. If you experience problems removing an event, see the Delete option of the "Daemon Manager Menu" . |
| Create Event Set | Displays the Event Set Management property sheet and allows you to create the definition of a new event set. See "Creating or Modifying an Event Set" . |
| Modify Event Set | Modifies the definition of an existing event set. See "Creating or Modifying an Event Set" . |
| Remove Event Set | Removes the selected event set from the Event window. |
| Save History | Saves the contents of the Event History page to a file. |
| Print History | Prints the contents of the Event History page to a file. |
| Clear History | Clears the contents of the Event History page to a file. |
| Administrator List | Displays a list of administrators in the Administrators dialog box. Each row in the list contains the Administrator's Name, Paging Service, Email Service, and Email ID. |
| | You can add, delete, and modify administrator information in the Administrators dialog box. When add or modify an administrator, the Administrator property sheet appears. The property sheet contains the General, Systems, and Availability pages. See "Managing Administrators" . |
| Configure Services | Displays the Services Configuration menu. You can configure Mail, Paging, or Modem information. |
| | To configure mail services, see "Configuring Mail Services" . |
| | To configure paging services, see "Configuring Paging Services" . |
| | To configure modem settings, dialing information, and trace log, see "Configuring the Modem" . |
Context-Sensitive Menus
If you select an item in the Event window with the right mouse button, the context-sensitive menu for that item appears. This menu is a subset of the Event menu.
Creating or Modifying an Event Set
Event sets include the service type and the event information that you want to monitor. Event sets can consist of multiple events. To create or modify an event set:
1. Choose the Create Event Set option from the Event menu to display the Event Set Management property sheet
2. Complete or modify the fields in the General and Events pages of the property sheet to create a new event set.
Note: The property sheet for creating a new event set is the same as the property sheet for modifying an event set, except that the event set name field is read-only.
See Figure 5 - 2 for an illustration of the Event Set Management property sheet.
Note: You can use several predefined event sets that have been installed with Oracle Enterprise Manager. See "Predefined Event Sets" .
Event Set Management General Page
On the General page, you determine the event set name, description, and service type.
| Name: | Enter an event set name. |
| Service Type: | Select a service type from the pull-down list. The types include Database, Node, or Listener. |
Note: Listener events are not available with this release.
| Description: | Enter a description for the event set. |
| Accept third party events | Check this box to allow the Event system to accept event sets that have been created by third-party vendors. |
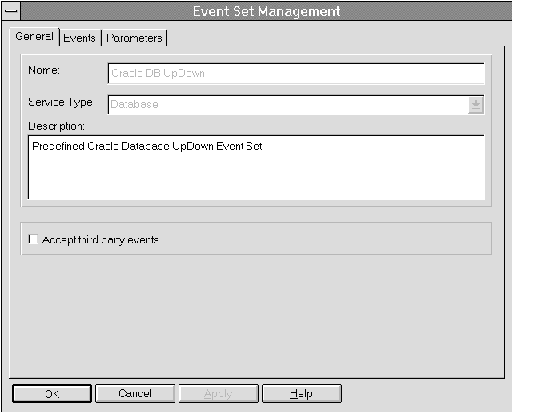 Figure 5 - 2. Event Set Property Sheet
Example
In the following example, a new event set for monitoring database space management is created and the General page is completed. Additional steps for completing the Events and Parameters Page are described in following sections.
1. To create a new event set, select Create Event Set from the Event Menu to display the General page of the Event Set Management property sheet.
2. Enter an event set name in the Name field.
3. Select Database from the Service Type pull-down list. The new event set will monitor Oracle databases.
4. Enter a brief description of and comments about the event set in the Description field.
5. Do not check the Accept third party events box.
This example continues in the following section.
Event Set Management Events Page
On the Events page, you determine the events that you want to monitor.
| Available Events: | Select the events in the list you want to monitor in this event set, then click on the << (Add) button to move the events to the Selected Events list. |
Note: For more information on predefined events, see "Predefined Events" .
| Selected Events: | Select the events in the list you want to remove from this event set, then click on the >> (Remove) button. |
Example
In the following example, the Events page is completed for a new event set. Additional steps for completing the Parameters Page are described in following section. The steps in this example are a continuation of an example on creating a new event set.
6. Click on the Events page tab to display the Events page.
7. Select the Archive Full event. This Space management event monitors the amount of available space left on the device where archive logs are stored.
8. Click on the << (Add) button. The event is moved to the Selected Events list and will be added to the event set.
9. Select the Maximum Extents event. This Space management event monitors the number of available extents for table, index, cluster, or rollback segments.
10. Click on the << (Add) button. The event is moved to the Selected Events list and will be added to the event set.
This example continues in the following section.
Event Set Management Parameters Page
The fixit job, frequency, and parameter settings are entered in the Event Information section of the Parameters page of the Event Set Management property sheet. The settings and types of parameters vary according to the event selected. Some events do not have parameters.
Choose Fixit Job
Select an existing fixit job from the pull-down list. These are jobs that have been created with the Job system and have been designated as fixit jobs. The jobs must be submitted and running on the same destination that the event is set on.
For example, you may want the agent to run a job to restart a database when the database instance has shut down unexpectedly.
Select <None> to stop a fixit job from executing.
For more information, see "Job Scheduling" .
Frequency
Determine the frequency that you want the event to monitor the selected destinations. The frequency determines how often the event condition is checked. For example, if the frequency is set to 30 seconds, the event condition is checked every 30 seconds. To ensure timely notification, set the frequency to the smallest interval possible. To set the frequency:
- Enter a value in the frequency field or select a value from the pull-down list.
- Select the interval units from the pull-down list.
See "Handling Events" for details on the notification frequency.
Parameters
The parameters for an event are displayed when the event is selected in the Selected Events list. The parameters vary according to the event selected. Some events do not have parameters.
You can accept the default values or change the values for the parameters. To enter parameter values for an event:
- Enter a value directly into a parameter field.
- Double-click on an item in a scrolling list to display the parameter dialog box. Enter a value in a parameter field.
Note: For information on the parameters for each event, see "Predefined Events" .
Example
In the following example, the Parameters page is completed for a new event set. The steps in this example are a continuation of an example on creating a new event set.
11. Click on the Parameters page tab to display the Parameters page.
12. Select Archive Full in the Selected Events list to display the Event Information and Parameters for the event.
13. Do not select a fixit job. These are jobs that have been created with the Job system and have been designated as fixit jobs.
14. Do not change the frequency that the event monitors the destination. The default frequency interval is acceptable.
15. Change the Alert and Warning threshold values to 3000 and 6000 respectively. Place the cursor in the field and edit the default values. You can also select the entire default value and enter the new value.
16. Select Maximum Extents in the Selected Events list to display the Event Information and Parameters for the event.
17. Do not select a fixit job. These are jobs that have been created with the Job system and have been designated as fixit jobs.
18. Do not change the frequency that the event monitors the destination. The default frequency interval is acceptable.
19. Double-click on Warning threshold in the scrolling list, to change the value of the parameter.
20. Enter 3 in the New Value field of the Enter Parameter Value dialog box, then click the OK button.
21. Double-click on Alert threshold in the scrolling list, to change the value of the parameter.
22. Enter 2 in the New Value field of the Enter Parameter Value dialog box, then click the OK button.
23. Do not change the other parameters. Note that the * in the Tablespace name, Segment name, and Segment type parameter fields signifies all existing values.
24. Click the OK button at the bottom of the property sheet to save and exit. The new event set appears in the Event Set Library page of the Event window.
You can now register this event set to the destinations you want to monitor.
Registering, Modifying, or Viewing an Event Set
You need to register, or apply, an event set to monitor events on specific destinations in the network environment. To register an event set:
1. Choose the Register Event Set option of the Event menu to display the Register Event Set property sheet.
2. Complete the fields in the General and Notification pages of the property sheet to register the event set.
Note: There is usually a slight delay between the registering the event set and the notification by the agent.
To modify or view an event set:
1. Select a registered event set in the Registrations page of the Event window.
2. Choose the Modify Registration option of the Event menu to display the Modify Registration property sheet.
3. You can modify fields in the Notification page but not the General page. Display the Status page to view of the status of each event at every destination.
The Register Event Set and Modify Registration property sheets are very similar. The property sheets contain:
- General page (read only when modifying)
- Status page (Modify Registration only)
Registrations General Page
On the General page, you identify the event set and destinations that you want the event set to monitor.
Warning: Do not register an UpDown event against the database or node where the repository table is stored. Note that the UpDown event is included the Oracle DB Fault predefined event set.
The communication between the agent and communication daemon can cause problems with the repository database connection. If the database or node is down, the event cannot notify the Console because the repository is not available.
| Service Type: | Select a service type from the pull-down list. The types include Database, Node, or Listener. |
| Set Name: | Select an existing event set name from the pull-down list. |
| Description: | Displays the description of the event set. |
The Available destinations vary according to the service type and event set selected.
| Available Destinations: | Select the destinations in the list you want to monitor in this event set, then click on the << (Add) button. |
Note: Only network objects that have an agent running are included in the list of available destinations.
| Selected Destinations: | Select the events in the list you want to remove from this event set, then click on the >> (Remove) button. |
Registrations Notification Page
On the Notification page, you determine who is notified and how they are notified for each destination.
Note: You need to set up administrators and notification methods before you complete this page. See "Managing Administrators" .
| Destination | Select a destination from the pull-down list. |
| Notify Operator on Duty | Check this option to notify the operator that is on duty when the event occurs. |
| Cause SNMP Trap At Agent | Check this box to trap the notification at the destination where the agent is located. ???? |
| Operators | Select an operator in the list, then select the notification method for this operator. |
| Notification Method | Choose the method for notifying the operator selected in the Operators list. |
- Check the EMail box to notify the selected operator by mail.
- Check the Paging box to notify the selected operator by pager.
Example
In the following example, an event set for monitoring database space management is registered to a group of databases.
1. To register the event set to a destination, select Register Event Set from the Event menu.
2. Select Database from the Service Type pull-down list in the General Page.
3. Select the event set name from the Set Name pull-down list.
4. Select a database from the Available Destinations list, then click on the << (Add) button. The database is moved to the Selected Destinations list and will be monitored for the events in the event set.
5. Repeat the previous step for several additional databases.
6. Click on the Notification page tab to display the Notification page.
7. Check the Notify Operator on Duty box. For this example, do not notify other administrators by paging or mail.
8. Click the OK button at the bottom of the property sheet to save and exit. The event set appears in the Registrations page of the Event window. Each destination database is listed separately with the event set.
9. After the agent for a destination processes the event set, the event set appears in the Outstanding Events page of the Event window.
When threshold values are exceeded for the events, a notification is sent to Console window. This notification will change the color of the circle in the Severity column for the event in the Outstanding Events page. If the destination database icon is displayed in the Map window, the flag on the icon changes color. The colors and their meaning are:
Registrations Status Page
On the Status page, you can view the status and output messages (if any) of each event at every destination where the event has been registered. The page contains the following:
| Destination | Select an event destination from the pull-down list. The events registered at this destination display in the Status of Registered Event list. |
| Status of Registered Event at Destination | Select an event in the list to view the error messages (if any) for the selected event. |
| Error Message for Event | Scroll through the list of messages (if any) to view the output of the event. The specific output of each event is described in "Predefined Events" . |
Example
To view the status and output messages of an event:
1. Select the event in the Registrations page of the Event window.
2. Select Modify Registration from the Event menu or double-click on the selected registration to display the Modify Registration property sheet.
3. Click on the Status page tab of the Modify Registration property sheet.
4. Select the Destination of the event.
5. Select the Name of the event in the Status of Registered Events list.
6. Scroll through the error messages (if any) in the Error Message for Event list.
Acknowledging an Event
Acknowledging events allows you to add comments to an event and move the event from the Outstanding Events to the Event History page.
To acknowledge an event that has occurred, double-click on the event in the Outstanding Events page to display the Acknowledge Event property sheet. You can also select an event and choose the Acknowledge option in the Event menu.
The Acknowledge Event property sheet contains the General and Notification pages. After you have viewed the information on the pages and entered any optional comments in the Comments field of the General page, you can:
- Click on the Move to History button to move the event to the History page.
- Click on the Keep button to save any comments and leave the event in the Outstanding Events page.
Acknowledge Event General Page
The General page contains the following fields. Only the Comments field can be updated.
| Event | Name of the event. |
| Date | Date that the event occurred. |
| System | System where the event occurred. |
| Node | Destination node. |
| Event Message | A message describing the event that took place. |
| Comments | Enter an optional comment for this event. Comments are a useful for explaining how the problem was corrected. |
Acknowledge Event Notification Page
The Notification page contains the Notification Status field. This field is for display only and cannot be updated.
Managing Administrators
EMS allows you to set up the administrators that are notified when an event occurs. You can then select specific administrators to be notified when applying an event set. When using a paging service or mail notification, each administrator can be assigned responsibility for specific systems at specific days and times.
Each administrator can be associated with both an email ID and a pager number. The administrator's schedule can be set up for any hours on any days of the week by system. For example, an administrator can be scheduled from 7:00 AM through 12:00 PM from Monday to Friday, 10:00AM through 2:00 PM on Saturday, and not available on Sunday.
Note: If you plan to use an mail or paging service for notification, you need to configure the mail, paging, and modem settings for your system before you set up administrators. See "Configuring Mail Services" , "Configuring Paging Services" , and "Configuring the Modem" .
To manage administrators, choose Administrator List in the Event menu to display the Administrator List dialog box. From the dialog box, you can add, modify, and delete administrators.
Adding Administrators
To add a new administrator definition:
1. Click on the Add button in the Administrator dialog box to display the Administrator property sheet.
2. Complete the General, Systems, and Availability pages in the Administrator property sheet to set up a new administrator.
Modifying Administrators
To modify an administrator definition:
1. Select an administrator in the list.
2. Click on the Modify button in the Administrator dialog box to display the Administrator property sheet.
3. Modify the General, Systems, and Availability pages in the Administrator property sheet.
Deleting Administrators
To delete an administrator definition:
1. Select an administrator in the list
2. Click on the Delete button in the Administrator dialog box to delete the administrator.
Administrator General Page
The General page contains the Administrator's Name, Comments, Paging Information, and EMailing Information. Complete this page to set up the paging service and email address for the administrator.
| Name: | Enter the name of the administrator. |
| Comments: | Enter any comments. |
Paging Information:
| Carrier: | Select the the name of the paging carrier service from the pull-down list. The carriers are set up with the Configure Paging Services option in the Event menu. |
| Pin: | Enter the paging Pin. |
| Test | Click the Test buttons to check the accuracy of the Paging information. Enter a message and click on the Send button to test the paging service for the selected administrator. |
EMailing Information:
| MAPI Mail ID: | Enter the MAPI mail address of the administrator. |
| SMTP Mail ID: | Enter the SMTP mail address of the administrator. |
| Test | Click the Test buttons to check the accuracy of the mail information. Enter a message and click on the Send button to test the email address for the administrator. |
Administrator Systems Page
The Systems page defines the systems that the administrator is responsible for.
| Available Systems: | Select the names of the systems that the administrator is responsible for, then click the << (Add) button. |
| Systems responsible for: | Select the names of the systems that the administrator is no longer responsible for, then click the >> (Remove) button. |
Administrator Availability Page
The Availability page defines the Notification method and the Availability of the administrator for each system that the administrator is responsible for.
| Notification: | Select the notification method, All, Email, or Paging, from the pull-down list. |
| | Paging is recommended for urgent events or critical systems. |
| Systems responsible for: | Select the name of the system in the tree list that the administrator is responsible for. |
| Availability | Select the hours and days of the week in the table when the administrator is available for the system selected in the list. |
Configuring Mail Services
The Mail Configuration dialog box allows you to determine the mail service information for your system. You must set up this information correctly to notify administrators by mail.
To configure mail services, choose the Configure Services - Mail option from the Event menu to display the Mail Configuration dialog box. Define the information in the following fields:
You should set up the mail engine to match the mail engine of your system.
| Current Mail Engine | Select the mail engine from the following options in the pull-down list: |
MAPI Setup
| Send Mail As | Enter the method for sending the mail. |
| Password | Enter the password. |
SMTP Setup
| Send Mail As | Enter the method for sending the mail. |
| SMTP Server: | Enter the SMTP server. |
Configuring Paging Services
You configure the paging service names, access numbers, and communication settings with the Paging Services Configuration dialog box. These paging services can be assigned to the administrators you define in the Administrator List dialog box.
To configure paging services, choose Configure Services - Paging option in the Event menu to display the Paging Services Configuration dialog box. From this dialog box, you can add, modify, or delete paging services.
Adding Paging Services
To add a new paging service:
1. Select the Add button in the Paging Services Configuration dialog box.
2. Enter a name for the paging service in the Service Name field of the New Service Name dialog box. This name will appear in the General page of the Administrator property sheet. Select the OK button.
3. Enter the phone number that accesses the paging service in the Access Number field.
4. Determine the Communication Settings fields in the dialog box.
Modifying Paging Services
To modify a paging service:
1. Select a paging service name in the Paging Services Names list of the Paging Services Configuration dialog box.
2. Modify the phone number in the Access Number field if necessary.
3. Modify the Communication Settings fields in the dialog box if necessary.
Deleting Paging Services
To delete a paging service:
1. Select a paging service name in the Paging Services Names list of the Paging Services Configuration dialog box.
2. Select the Delete button.
Communication Settings
These settings define how the system communicates with the paging service. Contact the paging service for the correct settings.
| Baud Rate: | Select the baud rate from the pull-down list. |
| Data Bits: | Select the data bits from the pull-down list. |
| Stop Bits: | Select the stop bits from the pull-down list. |
| Parity: | Select the parity from the pull-down list. |
| Flow Control: | Select the flow control from the pull-down list. |
Configuring the Modem
You determine the system modem information, outside line dialing information, and trace log option with the Modem Settings dialog box. This information must be set up correctly to dial a paging service.
To configure the modem settings:
1. Choose the Configure Services - Modem option in the Event menu to display the Modem Settings dialog box.
2. Complete the fields in the dialog box.
Modem Settings
Complete the fields in the Modem Settings dialog box to set up the system modem.
| Serial Port | Select the serial port number of the modem connection from the pull-down list. |
| Modem Type | Select the modem type from the pull-down list. If your modem is not listed, choose Other. |
| Init Command | Enter the initialization string for the modem or accept the default command. Refer to your modem documentation for additional information. |
| Dialing Information | Check the box if you need to enter a prefix to access an outside line. Enter the prefix to access an outside line in the adjacent field. |
| Trace Log | Check the box to create a trace log. Enter the pathname of the log file in the adjacent field. |
<Oracle Enterprise Manager Concepts GuideOracle Enterprise Manager Concepts Guide