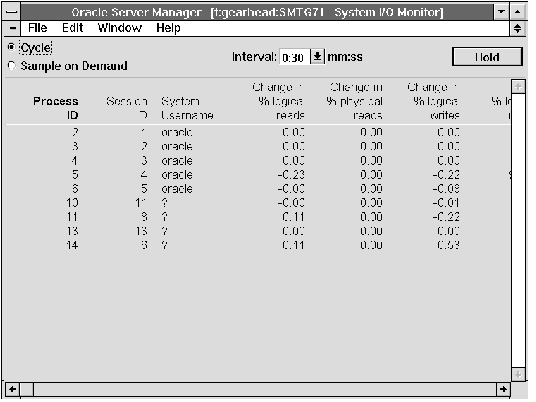


The following figure illustrates the left-most columns of the System I/O Monitor.
 Figure 11 - 13. System I/O Monitor
The System I/O Monitor is described below:
| Process ID | Oracle process identifier. |
| Session ID | Session identifier. |
| System Username | Username associated with the system process. |
| Change in % logical reads | Change in the percentage logical reads for the process since the last sample. |
| Change in % physical reads | Change in the percentage physical reads for the process since the last sample. |
| Change in % logical writes | Change in the percentage logical writes for the process since the last sample. |
| Total % logical reads | Logical reads for the process as a percentage of all logical reads since startup. |
| Total % physical reads | Physical reads for the process as a percentage of all physical reads since startup. |
| Total % logical writes | Logical writes for the process as a percentage of all logical writes since startup. |
MONITOR SYSTEMI/O
MONITOR SIO


