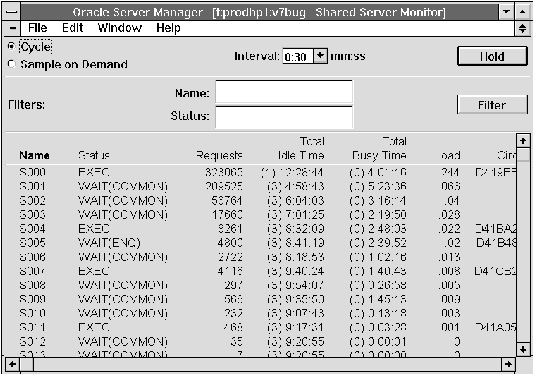


The following figure illustrates the left-most columns of the Shared Server Monitor.
 Figure 11 - 11. Shared Server Monitor
The Shared Server Monitor is described below:
| Name | Name of the shared server process. |
| Status | Status of the shared server process. |
| EXEC Executing SQL. | |
| WAIT (ENQ) Waiting for a lock. | |
| WAIT (SEND) Waiting to send data to the user. | |
| WAIT (COMMON) Idle, waiting for a user request. | |
| WAIT (RESET) Waiting for a circuit to reset after a break. | |
| QUIT Terminating. | |
| Requests | Total number of requests taken from the request queue by the server. |
| Total Idle Time | Total idle time for the server, expressed in: |
| (Days) Hours : Minutes : Seconds | |
| Total Busy Time | Total busy time for the server, expressed in: |
| (Days) Hours : Minutes : Seconds | |
| Load | The fraction of its lifetime that the server has been busy: |
| Busy Time/(Busy Time + Idle Time) | |
| Circuit | The address of the circuit that the server is currently serving. |
| Name | Filter for shared server name. Monitor displays information for servers whose names match the Name filter. |
| Status | Filter for the shared server status. Monitor displays information for servers with the specified status. |
MONITOR SHAREDSERVER
MONITOR SHARED


