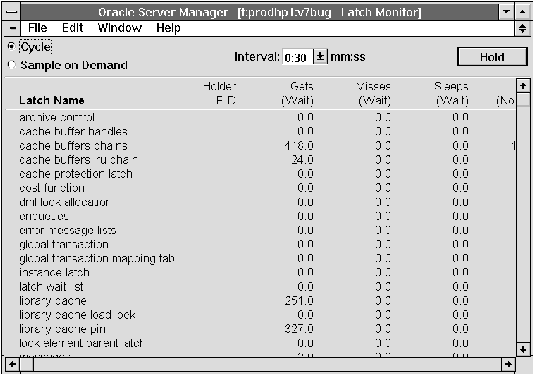


The following figure illustrates the left-most columns of the Latch Monitor.
 Figure 11 - 4. Latch Monitor
The Latch Monitor is described below:
| Latch Name | Name of the latch. |
| Holder PID | Process identifier for process currently holding the latch. |
| Gets (Wait) | Number of times, since the last sample, a process acquired the latch on its first attempt, but had to wait before acquiring it. |
| Misses (Wait) | Number of times, since the last sample, a process acquired the latch after failing on its first attempt. |
| Sleeps (Wait) | Number of times, since the last sample, a process went to sleep while waiting for the latch. |
| Gets (No Wait) | Number of times, since the last sample, a process acquired the latch without waiting. |
| Misses (No Wait) | Number of times, since the last sample, a process failed to acquire the latch and did not wait. |
MONITOR LATCH


