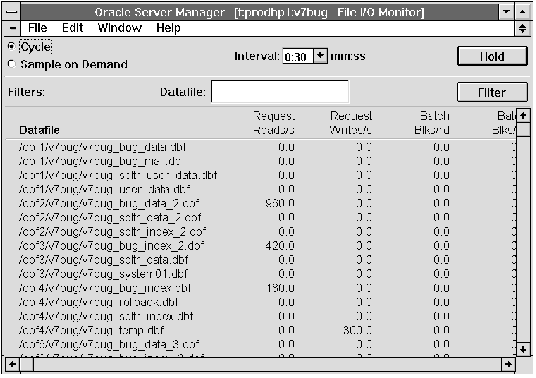


The following figure illustrates the left-most columns of the File I/O Monitor.
 Figure 11 - 3. File I/O Monitor
The File I/O Monitor is described below:
| Datafile | Name of the database file. |
| Request Reads/s | Number of physical reads per second since the last sample. |
| Request Writes/s | Number of physical writes per second since the last sample. |
| Batch Blks/rd | Number of physical blocks per read since the last sample. |
| Batch Blks/wt | Number of physical blocks per write since the last sample. |
| Resp Time ms/rd | Time per read, if TIMED_STATISTICS is TRUE. |
| Resp Time ms/wt | Time per write, if TIMED_STATISTICS is TRUE. |
| Datafile | Filter for the name of the database file. Monitor displays information for files whose names match the Datafile filter. |
MONITOR FILEI/O
MONITOR FILE
The product of Request Writes/s and Batch Blks/rd is the amount of data written to the file per second. If this value is high relative to the capacity of the corresponding disk, then you should consider changing the disk to one with a higher transfer rate.
When an index is generated or a SELECT statement is issued, a temporary sort file may be created. Look for excessive I/O to such files. Consider increasing the parameter SORT_AREA_SIZE or assigning different temporary tablespaces to different groups of users. For information about setting parameters, see the Oracle7 Server Administrator's Guide.


