


See Also: Your UNIX-specific documentation for detailed explanations of these tools.
Use TKPROF to:
See Also: Oracle7 Server Tuning for a full explanation of SQL trace and TKPROF/EXPLAIN PLAN.
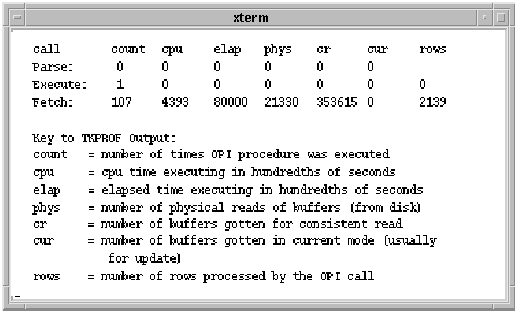 Figure 1 - 1. Sample Output from the TKPROF Utility
For example, the Server Manager File I/O display lists all the database files accessed by the Oracle Server, along with the statistics reflecting their I/O activity.
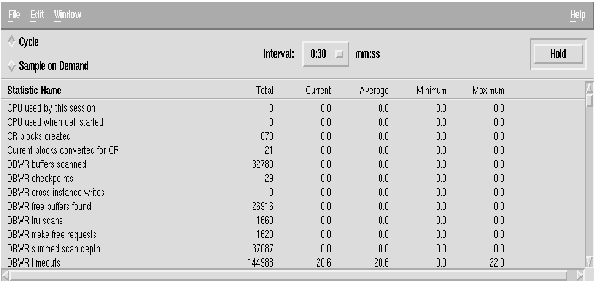 Figure 1 - 2. Sample Server Manager Output
See Also: Oracle Server Manager User's Guide for instructions for interpreting the displays.
The utilities create tables to help identify problem areas. For example, the latch statistics table shows latch contention and helps you tune the SPIN_COUNT parameter.
Before you run these scripts, set the TIMED_STATISTICS initialization parameter . The scripts are in the $ORACLE_HOME/rdbms/admin directory. Allow time for the database to stabilize before running the scripts.
To initiate the collection of statistics, enter:
$ cd $ORACLE_HOME/rdbms/admin
$ svrmgrl
SVRMGR> CONNECT INTERNAL
SVRMGR> CONNECT SYS/password
SVRMGR> @utlbstat
The utlbstat utility creates a set of tables and views in the SYS account. These tables contain the following snapshots of the state of the system at the beginning of the performance test.
| View/Table Name | Description |
| STATS$BEGIN_STATS | General stats from v$sysstat |
| STATS$FILE_VIEW | View of File I/O statistics |
| STATS$BEGIN_FILE | Table of File I/O statistics from STATS$FILE_VIEW |
| STATS$BEGIN_LATCH | Latch statistics from v$latch |
| STATS$BEGIN_ROLL | Rollback segment statistics from v$rollstat |
| STATS$BEGIN_KQRST | Dictionary Cache statistics from X$KQRST |
| STATS$DATES | Table with beginning date |
To end the collection of statistics, run the utlestat script. Like utlbstat, utlestat creates a set of tables and views in the SYS account. These tables contain a snapshot of the system at the end of the performance test. Table 1 - 5 lists the tables showing the end state of the system.
| View/Table Name | Description |
| STATS$END_STATS | General stats from V$SYSSTAT |
| STATS$END_FILE | Table of File I/O statistics from STATS$FILE view |
| STATS$END_LATCH | Latch statistics from V$LATCH |
| STATS$END_ROLL | Rollback segment statistics from V$ROLLSTAT |
| STATS$END_KQRST | Dictionary cache statistics from X$KQRST |
The utlestat utility creates a set of tables in the SYS account that outline the differences between the beginning state and end state statistics. Table 1 - 6 lists the database tables created.
| View/Table Name | Description |
| STATS$STATS | General system statistics |
| STATS$FILE | File I/O statistics |
| STATS$LATCHES | Latching statistics |
| STATS$ROLL | Rollback segment statistics |
| STATS$KQRST | Dictionary cache statistics |
| STATS$DATES | Table with ending date |
Finally, utlbstat produces a report in the current directory with performance statistics for each of the tables listed in Table 1 - 6. The report also includes an init.ora parameter listing, and the date of utlbstat and utlestat execution.
% vmstat -S 5 9
Figure 1 - 3 shows sample output from the vmstat command.
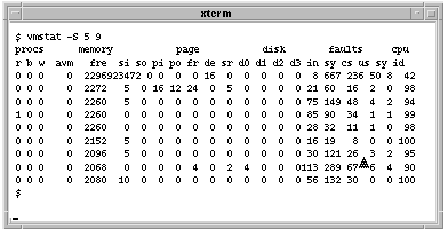 Figure 1 - 3. Sample Output from the vmstat Command
The w column indicates the number of potential processes that have been swapped out (written to disk). If the value is not zero, swapping is occurring and your system has a memory shortage problem. The si and so columns indicate the number of swap-ins and swap-outs per second, respectively. Swap-outs should always be zero.
$ sar -p 10 10
Figure 1 - 4 shows sample sar -p output.
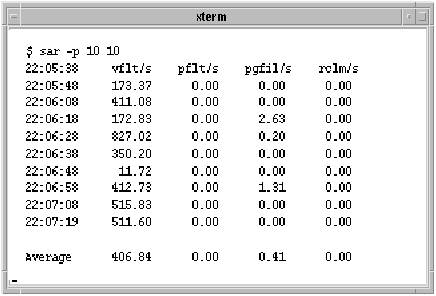 Figure 1 - 4. Sample Output from the sar Command
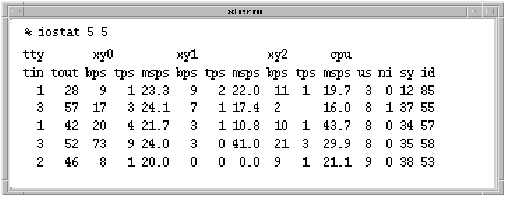 Figure 1 - 5. Sample Output from the iostat Command
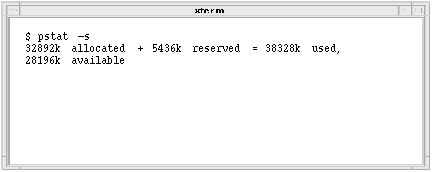 Figure 1 - 6. Sample Output from the pstat -s Command
 Figure 1 - 7. Sample Output from the swap -l Command
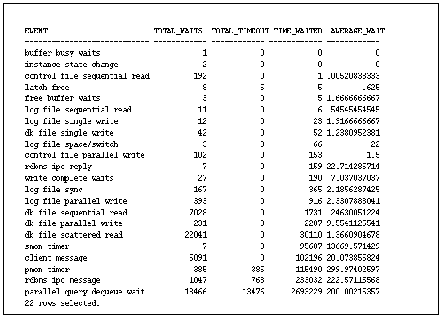 Figure 1 - 8. Sample Output from V$SESSION_WAIT Display


