| Previous | Table of Contents | Next |
This Korn shell script provides complete access to all of the reports in the database. Note that reports 1 through 7 can be parameterized, and the system will ask you to specify the database name and the date ranges.
Running The Oracle Reports And Alerts
The following parameters are required to run the script:
- 1. Database name (default is all databases)
- 2. Start date (default is 2000 BC)
- 3. End date (default is today)
- 2. Start date (default is 2000 BC)
Reports 6 and 7 (table and index reports) also prompt you to enter the number of extents that are used in the table or index query. The user will also be prompted for the following:
Enter the database name: (or press enter for all databases) cusdb
Enter a start date:(mm/dd/yy) (or press enter for none) 06/01/95
Enter an end date:(mm/dd/yy) (or press enter for none)
Where number of extents is greater than (default 0):30
Also note that reports 8 through 11 are the alert reports, whose criteria is described later in this chapter. The alert reports do not prompt for additional information.
A Closer Look—BMC’s Patrol
In the fiercely competitive marketplace of system monitoring tools, vendors are striving to create products that take care of the routine and mundane administrative tasks, freeing the DBA and system administrator to do more high-level work. With the advent of open systems and geographically diverse networks of distributed databases, a centralized tool for monitoring system performance has become indispensable. Patrol (by BMC Software) is one such product that claims to meet this need. You can find out more about Patrol by looking on this book’s Cd-ROM.
Marketed as an alert monitor, Patrol positions itself against products such as DBVision (by Platinum Software) and a host of other SNMP-compliant monitors. The goal of this type of tool is to provide an intelligent agent that will constantly monitor the database and operating environment, detecting extraordinary conditions (called events). Once detected, the event can trigger an intelligent script to automatically correct the problem while telephoning the beeper number of the on-call DBA. While this may sound like a lofty goal, Patrol has been very successful in creating a framework that removed much of the tedious monitoring from the DBA’s and SA’s job. Patrol is friendly enough that a naive operator can monitor dozens of hosts, drilling down quickly to identify the nature of any problems.
Patrol offers the ability to manage many different types of relational databases from a single console and currently supports a host of relational databases including Oracle, Sybase, Informix, DB2 version 2, OpenVMS, and CA-Ingres. In addition, Patrol offers special submodules for monitoring vendor application packages such as Oracle Financials. This ability to provide a common monitor for many diverse databases is one of the features of Patrol that appeals to large, multivendor database sites.
For such a sophisticated product, the installation of Patrol is relatively straightforward and consists of two steps: the installation of the “console” (the host that monitors the databases), and the installation of “agent” software on each agent that will be monitored. The installation guide is compact, yet well-written, and describes the procedures for loading the Patrol installer that is run to install the specific product components.
The front end for the console is Motif-based, offering an excellent GUI environment with a very intuitive drill-down capability. In fact, Patrol is so intuitive that an experienced DBA can instantly use the console to view a problem without any prior training. The main screen consists of one icon for each host, and the host will turn red to indicate that an event has been triggered within the knowledge module (see Figure 11.3).
)
Figure 11.3 The main Patrol console screen.
Clicking on the host icon will drill down into a set of database icons—one for each database on the host—and will also have icons for other components on the host, including file systems and disk devices. A drill-down from the database icon will show numerous database statistics. Despite these superior display capabilities, Patrol’s real value comes from its management of the user-defined rules that tell Patrol when something is amiss. Figure 11.4 displays the drill-down screen.
)
Figure 11.4 The drill-down Patrol screen.
Patrol’s Knowledge Module
Anyone who has ever used an alert monitor in a production environment knows that the effective use of a tool depends upon its ability to identify salient problems while avoiding false alerts (precision). At the same time, no real problems can be missed (recall). This balancing act between precision and recall requires a very flexible set of customizable rule bases—an area in which Patrol is very effective.
Patrol supports a dynamic knowledge base that allows DBAs to continually customize specific events within their system. For example, a DBA might be interested in knowing when a file system is nearly full. However, file systems that are dedicated to database files will always be full—falsely alerting the DBA about a condition that does not require any intervention. Patrol collects these decision rules and calls them knowledge modules or KMs. To Patrol, a knowledge module consists of a set of parameters with meaningful names such as BufferBusyRate and CacheHitRatio. (See Figure 11.5.) A knowledge module can be versioned, customized, and stored on the main console (the global KM) or on each remote agent (the local KM).
)
Figure 11.5 A Patrol Oracle parameter list.
The Patrol architecture provides a mechanism whereby the global knowledge module is referenced first, followed by any additional rules that are specific to an agent. This feature is especially useful for databases that have unique characteristics. For example, the value of LongTableScanRatio should stay below 80 percent for online transaction processing systems, but a LongTableScanRatio of 60 percent is perfectly acceptable for a batch-oriented reporting database that relies on full-table scans.
These parameters contain the following attributes:
- • Poll Time—A parameter may be scheduled to “fire” on a schedule.
- • Automated Recovery—Specific actions can be programmed to notify the DBA and trigger actions to automatically correct the problem.
- • Output Range—The values that trigger an alert condition. For example, by default, the value of MaximumExtents will trigger a warning when a table reaches 90 percent of available extents, and an alarm when reaching 95 percent of available extents.
- • Manual Recovery—This is a knowledge base that advises the DBA as to an appropriate corrective action. For example, the value of LibraryCacheHitRatio for Oracle correctly advises the DBA that increasing the value of shared_pool_size may relieve the problem. This feature of Patrol is especially nice for the newbie DBA who is not intimately familiar with corrective actions for database problems (see Figure 11.6).
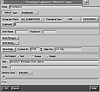
Figure 11.6 A Patrol Oracle parameter maintenance screen. - • Automated Recovery—Specific actions can be programmed to notify the DBA and trigger actions to automatically correct the problem.
)
| Previous | Table of Contents | Next |